A typical RNASeq analysis
Hong Zheng / 2017-09-18
This is a typical RNASeq analysis pipeline, not atypical.
Purpose
Given RNASeq data from two group of samples (sequenced from mice), control and treatment, find out the differentially expressed genes.
Scripts can also be found in https://github.com/zhengh42/RNASeq_MM.
Download reference and prepare index
#######
# These steps are performed in linux/bash, in reference/ directory
# Script location: reference/run_download_index.sh
# Kallisto and Salmon are from pre-built Docker images. Scripts for building the images can be found in https://github.com/zhengh42/Dockerfiles
#######

#######
# Download from Gencode release M15
#######
wget ftp://ftp.sanger.ac.uk/pub/gencode/Gencode_mouse/release_M15/GRCm38.primary_assembly.genome.fa.gz
wget ftp://ftp.sanger.ac.uk/pub/gencode/Gencode_mouse/release_M15/gencode.vM15.annotation.gtf.gz
wget ftp://ftp.sanger.ac.uk/pub/gencode/Gencode_mouse/release_M15/gencode.vM15.transcripts.fa.gz
gzip -d *.gz

#######
# Stats of Gencode release M15
#######
# Number of genes: 52550
less gencode.vM15.annotation.gtf | awk '$3=="gene"' | wc -l
# Number of transcript: 131100
less gencode.vM15.annotation.gtf | awk '$3=="transcript"' | wc -l
less gencode.vM15.transcripts.fa | grep '^>' | wc -l
# Get gene name and type
less gencode.vM15.annotation.gtf  | awk '$3=="gene"' | cut -f9 | awk '{print $2,$4,$6}' | sed 's/[";]//g;s/\s\+/\t/g' | sed '1i geneid\tgenetype\tgenename' > gene.info

#######
# Generate transcript to gene mapping file
#######
less gencode.vM15.transcripts.fa | egrep '^>' | sed 's/^>//' | awk 'OFS="\t"{print $0,$0}' | sed 's/|/\t/;s/|/\t/' | awk 'OFS="\t"{print $4,$2}' > tx2gene.txt

transcripts_fasta=gencode.vM15.transcripts.fa
#######
# Kallisto index
#######
docker run -v $PWD:/mnt zhengh42/kallisto:0.43.1 kallisto index -i /mnt/M15.gencode.kallisto.idx /mnt/$transcripts_fasta

#######
# Salmon index
#######
docker run -v $PWD:/mnt zhengh42/salmon:0.8.2 salmon index -i /mnt/M15.gencode.salmon.idx -t /mnt/$transcripts_fasta
QC and transcript-level expression quantification
#######
# These steps are performed in linux/bash, in scripts/ directory
# Trim-galore is from pre-built Docker images. Scripts for building the images can be found in https://github.com/zhengh42/Dockerfiles
# Script location: scripts/run_indiv.sh
# How to run:
# ./run_indiv.sh sham1 Raw_sham1
# ./run_indiv.sh sham2 Raw_sham2
# ./run_indiv.sh sham3 Raw_sham3
# ./run_indiv.sh WT_Ang1 Raw_WT_Ang1
# ./run_indiv.sh WT_Ang2 Raw_WT_Ang2
# ./run_indiv.sh WT_Ang3 Raw_WT_Ang3
#######

#######
# Arguments setup
#######
id=$1
id2=$2
raw_dir=/srv/gevaertlab/data/Hong/RNASeq/hb/Reads
work_dir=/srv/gevaertlab/data/Hong/RNASeq/hb/RNASeq_MM_HB/
ref_dir=$work_dir/reference

#######
# QC with trim-galore and fastqc
#######
docker run -v $raw_dir:/home zhengh42/trim-galore:0.4.4  \
        trim_galore -q 15  --stringency 3 --gzip --length 15 --paired
        /home/$id/${id2}_1.fq.gz /home/$id/${id2}_2.fq.gz --fastqc --output_dir /home
        1> ../logs/$id.trim_galore.log 2>&1

#######
# Get the stand-specific information of the reads
# In the log file of salmon output: Automatically detected most likely library type as ISR
#######
zcat $raw_dir/${id2}_1_val_1.fq.gz | head -n 400000 | gzip > $raw_dir/${id2}_test_1.fq.gz
zcat $raw_dir/${id2}_2_val_2.fq.gz | head -n 400000 | gzip > $raw_dir/${id2}_test_2.fq.gz
docker run -v $raw_dir:/home/seq -v $ref_dir:/home/ref -v $work_dir/results/salmon:/home/out  \
        zhengh42/salmon:0.8.2 \
        salmon quant -i /home/ref/M15.gencode.salmon.idx -l A \
        -o /home/out/$id.test -1 /home/seq/${id2}_test_1.fq.gz -2 /home/seq/${id2}_test_2.fq.gz \
        1> ../logs/$id.salmon.log 2>&1

#######
# Get transcript level expression estimate using Kallisto
# Since the library type is ISR, --rf-stranded argument is specified
# More information on the library type and strand information, see http://fishycat.netlify.com/en/2017/08/strandness_in_rnaseq/
#######
docker run -v $raw_dir:/home/seq -v $ref_dir:/home/ref -v $work_dir/results/kallisto:/home/out \
        zhengh42/kallisto:0.43.1 \
        kallisto quant -i /home/ref/M15.gencode.kallisto.idx \
        -o /home/out/$id /home/seq/${id2}_1_val_1.fq.gz /home/seq/${id2}_2_val_2.fq.gz  \
        -b 100 --rf-stranded --fusion  1> ../logs/$id.kallisto.log 2>&1
Differential expression analysis
#######
# The following steps are performed in R, in scripts/ directory
#######

#######
# Load required packages, set up directory, read in files
#######
library(readr)
library(tximport)
require("knitr")
require(DESeq2) # version 1.16.1
require(IHW)
require(dplyr)
require(ComplexHeatmap)
require(vsn)
require(RColorBrewer)
require(ggplot2)

work_dir<- "/srv/gevaertlab/data/Hong/RNASeq/hb/RNASeq_MM_HB/"
opts_knit$set(root.dir = work_dir)
sampleID <- scan(paste0(work_dir,"sampleID"),what="character",quiet=TRUE)
geneinfo<-read.table(paste0(work_dir,"reference/gene.info"),head=T,sep = "\t")

#######
# Get gene-level expression from transcript level results of Kallisto
#######
files.kallisto <- file.path(paste0(work_dir,"results/kallisto"),sampleID,"abundance.tsv")
all(file.exists(files.kallisto))
names(files.kallisto)<- sampleID
tx2gene<-read.table(paste0(work_dir,"reference/tx2gene.txt"))
Kallisto.txim <- tximport(files.kallisto,type="kallisto",tx2gene = tx2gene)
write.csv(Kallisto.txim,file=paste0(work_dir, "results/kallisto/Kallisto.txim.txt"),row.names = T)
1. DESeq2
#######
# Read in data and pre-filtering
#######
sampleTable=data.frame(condition = factor(rep(c("wt-sham","wt-ang"),each=3)))
rownames(sampleTable) = colnames(Kallisto.txim$counts)
dds<- DESeqDataSetFromTximport(Kallisto.txim,sampleTable,~condition)
dds$condition <- factor(dds$condition, levels = c("wt-sham","wt-ang"))
dim(dds) #[1] 52550     6
# Only genes with at least two counts across the samples were kept
dds <- dds[ rowSums(counts(dds)) > 1, ]
dim(dds) #[1] 31043     6

#######
# Generate DESeq object
#######
dds <- DESeq(dds)

#######
# Different approaches of tranformation. DESeq uses regularized log transformation as default.
#######
# Shifted logarithm transformation, log2(n + 1), has elevated standard deviation in the lower count range.
ntd <- normTransform(dds)
meanSdPlot(assay(ntd))
![]()
# Regularized log transformation, less elevated standard deviation in the lower count range.
rld <- rlog(dds, blind=FALSE)
meanSdPlot(assay(rld))
![]()
# Variance stabilizing transformation.It may over-correct standard deviation and mask true differences due to the experimental conditions.
vsd <- varianceStabilizingTransformation(dds, blind=FALSE)
meanSdPlot(assay(vsd))
![]()
#######
# Data quality assessment by sample clustering and visualization
#######
# Sample clustering based on first 400 highly-expressed genes
select <- order(rowMeans(counts(dds,normalized=TRUE)),
                decreasing=TRUE)[1:400]

p<- Heatmap(assay(rld)[select,],
        clustering_distance_rows = "euclidean", clustering_distance_columns = "euclidean",
        clustering_method_rows  = "average",clustering_method_columns  = "average",
        show_row_names =F,
        name="distance",
        column_names_gp = gpar(fontsize = 9)
             )
draw(p,newpage = T)

### Heatmap of the sample-to-sample distances
sampleDists <- dist(t(assay(rld)))
sampleDistMatrix <- as.matrix(sampleDists)
colnames(sampleDistMatrix) <- NULL

colors <- colorRampPalette( rev(brewer.pal(9, "Oranges")) )(255)
p<- Heatmap(sampleDistMatrix,
        clustering_distance_rows = "euclidean", clustering_distance_columns = "euclidean",
        clustering_method_rows  = "average",clustering_method_columns  = "average",
        col=colors,
        name="Distance",
        column_names_gp = gpar(fontsize = 9)
             )
draw(p,newpage = T)

# PCA plot
pcaData <- plotPCA(rld, intgroup=c("condition"), returnData=TRUE)
percentVar <- round(100 * attr(pcaData, "percentVar"))
ggplot(pcaData, aes(PC1, PC2, color=condition,shape=name)) +
  geom_point(size=3) +
  xlab(paste0("PC1: ",percentVar[1],"% variance")) +
  ylab(paste0("PC2: ",percentVar[2],"% variance")) +
  coord_fixed()

QC summary
From the clustering and visualization plots above, we can see that sham1 and sham2 always cluster together, as well as Ang1 and Ang2. However, instead of clustering with sham group, sham3 always clusters with Ang group. Is there any problem with this sample?
To accurately measure fold change, two versions of differential expression analysis was performed, one with sham3 and one with out.
Differential expression analysis with all samples
#######
# Differential expression analysis
#######
res <- results(dds)
# Get moderated and shrunken log2 fold changes. No effect on p values
resLFC <- lfcShrink(dds, coef=2, res=res)

#######
# MA plot
#######
plotMA(res, ylim=c(-2,2))
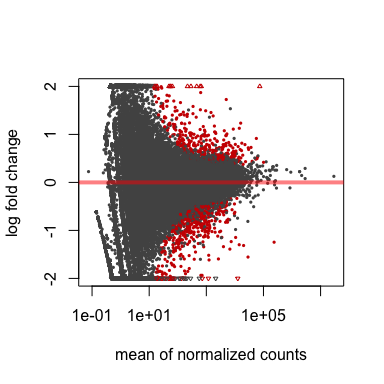
plotMA(resLFC, ylim=c(-2,2))

#######
# Choose top differentially-expressed genes
#######
# By default, DESeq performs independent filtering based on the mean of normalized counts for each gene, optimizing the number of genes which will have an adjusted p value below a given FDR cutoff (default 0.1). Using alpha to change the threshold: results(dds, alpha=0.2)
summary(res)

##
## out of 31043 with nonzero total read count
## adjusted p-value < 0.1
## LFC > 0 (up)     : 365, 1.2%
## LFC < 0 (down)   : 444, 1.4%
## outliers [1]     : 15, 0.048%
## low counts [2]   : 12635, 41%
## (mean count < 14)
## [1] see 'cooksCutoff' argument of ?results
## [2] see 'independentFiltering' argument of ?results

# Filtering by Independent Hypothesis Weighting
resIHW <- results(dds, filterFun=ihw)
summary(resIHW)

##
## out of 31043 with nonzero total read count
## adjusted p-value < 0.1
## LFC > 0 (up)     : 404, 1.3%
## LFC < 0 (down)   : 439, 1.4%
## outliers [1]     : 15, 0.048%
## [1] see 'cooksCutoff' argument of ?results
## [2] see metadata(res)$ihwResult on hypothesis weighting
There are 809 genes with adjusted p value less than 0.1 using default independent filtering.
There are 843 genes with adjusted p value less than 0.1 using independent hypothesis weighting filtering.
######
# Write results
#######
DESeq.gene.out <- as.data.frame(res)
DESeq.gene.out$log2FoldChange_lfc <- resLFC$log2FoldChange
DESeq.gene.out$padj_IHW <- resIHW$padj
DESeq.gene.out$geneid <- rownames(res)
DESeq.geneanno.out <- merge(x=DESeq.gene.out,y=geneinfo,by = "geneid", all.x = TRUE)

Kallisto.txim.abundance <- as.data.frame(Kallisto.txim$abundance)
colnames(Kallisto.txim.abundance) <- gsub("^","TPM.",colnames(Kallisto.txim.abundance))
Kallisto.txim.abundance$geneid<-rownames(Kallisto.txim.abundance)
Kallisto.txim.counts <- as.data.frame(Kallisto.txim$counts)
colnames(Kallisto.txim.counts) <- gsub("^","counts.",colnames(Kallisto.txim.counts))
Kallisto.txim.counts$geneid<-rownames(Kallisto.txim.counts)

DESeq.geneanno.out<-merge(x=DESeq.geneanno.out,y=Kallisto.txim.abundance,by = "geneid", all.x = TRUE)
DESeq.geneanno.out<-merge(x=DESeq.geneanno.out,y=Kallisto.txim.counts,by = "geneid", all.x = TRUE)
DESeq.geneanno.out.ordered<-DESeq.geneanno.out[order(DESeq.geneanno.out$padj_IHW),]

# What are the types of the genes?
table(DESeq.geneanno.out.ordered$genetype)

##
##           3prime_overlapping_ncRNA                      antisense_RNA
##                                  1                               1684
##      bidirectional_promoter_lncRNA                          IG_C_gene
##                                107                                 11
##                    IG_C_pseudogene                          IG_D_gene
##                                  0                                  0
##                    IG_D_pseudogene                          IG_J_gene
##                                  0                                  9
##                         IG_LV_gene                      IG_pseudogene
##                                  0                                  0
##                          IG_V_gene                    IG_V_pseudogene
##                                111                                  2
##                            lincRNA                       macro_lncRNA
##                               2763                                  0
##                              miRNA                           misc_RNA
##                                811                                173
##                            Mt_rRNA                            Mt_tRNA
##                                  2                                 22
##             polymorphic_pseudogene               processed_pseudogene
##                                 23                               2306
##               processed_transcript                     protein_coding
##                                626                              18179
##                         pseudogene                           ribozyme
##                                 49                                  9
##                               rRNA                             scaRNA
##                                 31                                 29
##                              scRNA                     sense_intronic
##                                  1                                284
##                  sense_overlapping                             snoRNA
##                                 20                                323
##                              snRNA                               sRNA
##                                299                                  1
##                                TEC                          TR_C_gene
##                               2510                                  7
##                          TR_D_gene                          TR_J_gene
##                                  0                                 46
##                    TR_J_pseudogene                          TR_V_gene
##                                  3                                 29
##                    TR_V_pseudogene   transcribed_processed_pseudogene
##                                  2                                159
##     transcribed_unitary_pseudogene transcribed_unprocessed_pseudogene
##                                 10                                128
##                 unitary_pseudogene             unprocessed_pseudogene
##                                  4                                269

# Get lncRNA genes
lncrna<-c("lincRNA","antisense_RNA","sense_intronic","sense_overlapping","TEC")
DESeq.geneanno.out.ordered.lncRNA <- DESeq.geneanno.out.ordered %>% filter(genetype %in% lncrna)

write.table(DESeq.geneanno.out.ordered.lncRNA,file = "DESeq.geneanno.out.ordered.lncRNA.txt",sep="\t",quote = F,row.names = F)
write.table(DESeq.geneanno.out.ordered,file = "DESeq.geneanno.out.ordered.txt",sep="\t",quote = F,row.names = F)
Differential expression analysis without sham3
# Start with Kallisto data import
files.kallisto_a <- files.kallisto[-which(names(files.kallisto) %in% c("sham3") )]
Kallisto.txim_a <- tximport(files.kallisto_a,type="kallisto",tx2gene = tx2gene)

# DESeq
sampleTable_a <- sampleTable[-which(rownames(sampleTable)  %in% c("sham3")),,F]
dds_a<- DESeqDataSetFromTximport(Kallisto.txim_a,sampleTable_a,~condition)

dds_a$condition <- factor(dds_a$condition, levels = c("wt-sham","wt-ang"))
dim(dds_a) #[1] 52550     6
# Only genes with at least two counts across the samples were kept
dds_a <- dds_a[ rowSums(counts(dds_a)) > 1, ]
dim(dds_a) #[1] 30796     5

dds_a <- DESeq(dds_a)
res_a <- results(dds_a)
resLFC_a <- lfcShrink(dds_a, coef=2, res=res_a)

#######
# MA plot
#######
plotMA(res_a, ylim=c(-2,2))

plotMA(resLFC_a, ylim=c(-2,2))

# Choose top differentially-expressed genes
summary(res_a)

##
## out of 30796 with nonzero total read count
## adjusted p-value < 0.1
## LFC > 0 (up)     : 1251, 4.1%
## LFC < 0 (down)   : 1102, 3.6%
## outliers [1]     : 0, 0%
## low counts [2]   : 14330, 47%
## (mean count < 28)
## [1] see 'cooksCutoff' argument of ?results
## [2] see 'independentFiltering' argument of ?results

# Filtering by Independent Hypothesis Weighting
resIHW_a <- results(dds_a, filterFun=ihw)
summary(resIHW_a)

##
## out of 30796 with nonzero total read count
## adjusted p-value < 0.1
## LFC > 0 (up)     : 1342, 4.4%
## LFC < 0 (down)   : 1108, 3.6%
## outliers [1]     : 0, 0%
## [1] see 'cooksCutoff' argument of ?results
## [2] see metadata(res)$ihwResult on hypothesis weighting
There are 2353 genes with adjusted p value less than 0.1 using default independent filtering.
There are 2450 genes with adjusted p value less than 0.1 using independent hypothesis weighting filtering.
# Write results
DESeq.gene.out_a <- as.data.frame(res_a)
DESeq.gene.out_a$log2FoldChange_lfc <- resLFC_a$log2FoldChange
DESeq.gene.out_a$padj_IHW <- resIHW_a$padj
DESeq.gene.out_a$geneid <- rownames(res_a)
DESeq.geneanno.out_a <- merge(x=DESeq.gene.out_a,y=geneinfo,by = "geneid", all.x = TRUE)

DESeq.geneanno.out_a<-merge(x=DESeq.geneanno.out_a,y=Kallisto.txim.abundance,by = "geneid", all.x = TRUE)
DESeq.geneanno.out_a<-merge(x=DESeq.geneanno.out_a,y=Kallisto.txim.counts,by = "geneid", all.x = TRUE)
DESeq.geneanno.out.ordered_a<-DESeq.geneanno.out_a[order(DESeq.geneanno.out_a$padj_IHW),]

# What are the types of the genes?
table(DESeq.geneanno.out.ordered_a$genetype)

##
##           3prime_overlapping_ncRNA                      antisense_RNA
##                                  1                               1654
##      bidirectional_promoter_lncRNA                          IG_C_gene
##                                107                                 11
##                    IG_C_pseudogene                          IG_D_gene
##                                  0                                  0
##                    IG_D_pseudogene                          IG_J_gene
##                                  0                                  8
##                         IG_LV_gene                      IG_pseudogene
##                                  0                                  0
##                          IG_V_gene                    IG_V_pseudogene
##                                105                                  2
##                            lincRNA                       macro_lncRNA
##                               2736                                  0
##                              miRNA                           misc_RNA
##                                799                                171
##                            Mt_rRNA                            Mt_tRNA
##                                  2                                 21
##             polymorphic_pseudogene               processed_pseudogene
##                                 22                               2242
##               processed_transcript                     protein_coding
##                                623                              18117
##                         pseudogene                           ribozyme
##                                 48                                  9
##                               rRNA                             scaRNA
##                                 31                                 29
##                              scRNA                     sense_intronic
##                                  1                                284
##                  sense_overlapping                             snoRNA
##                                 20                                320
##                              snRNA                               sRNA
##                                294                                  1
##                                TEC                          TR_C_gene
##                               2498                                  7
##                          TR_D_gene                          TR_J_gene
##                                  0                                 45
##                    TR_J_pseudogene                          TR_V_gene
##                                  3                                 27
##                    TR_V_pseudogene   transcribed_processed_pseudogene
##                                  2                                158
##     transcribed_unitary_pseudogene transcribed_unprocessed_pseudogene
##                                 10                                125
##                 unitary_pseudogene             unprocessed_pseudogene
##                                  3                                260

# Get lncRNA genes
lncrna<-c("lincRNA","antisense_RNA","sense_intronic","sense_overlapping","TEC")
DESeq.geneanno.out.ordered.lncRNA_a <- DESeq.geneanno.out.ordered_a %>% filter(genetype %in% lncrna)

write.table(DESeq.geneanno.out.ordered.lncRNA_a,file = "DESeq.geneanno.out.ordered.lncRNA.wosham3.txt",sep="\t",quote = F,row.names = F)
write.table(DESeq.geneanno.out.ordered_a,file = "DESeq.geneanno.out.ordered.wosham3.txt",sep="\t",quote = F,row.names = F)
Easy report
#######
# This report is based on DESeq analysis of all samples, default filtering. See ./reports for details.
#######
des2Report <- HTMLReport(shortName = 'RNAseq_analysis_with_DESeq2',
  title = 'RNA-seq analysis of differential expression using DESeq2',
  reportDirectory = "./reports")
publish(dds,des2Report, pvalueCutoff=0.1,
  annotation.db="org.Mm.eg.db", factor = colData(dds)$condition,
  reportDir="./reports")
finish(des2Report)
Other notes
What’s in the output file?
- geneid
- log2FoldChange, default fold change output by DESeq2.
- pvalue
- padj, adjusted p value
- log2FoldChange_lfc, moderated and shrunken log2 fold changes, more conservative (and accurate?)
- padj_IHW, adjusted p value of independent hypothesis weighting
(smaller, which results in more differentially-expressed genes)
- genetype
- genename
- TPM.sample, the transcript per million of the gene in the sample
- counts.sample, the read counts of the gene in the sample